Exelon (EXC) analysis delayed due to possible merger with Constellation Energy Group (CEG).

I was going to start analyzing Exelon (EXC) because it pasted my mechanical tests, but today’s news of its possible acquisition of rival Constellation Energy (CEG) has scared me off until later.  All three major areas of analysis will change: dividend record, earning power, and strength of balance sheet.

Subscribe today for free at www.myhighdividendstocks.com/feed to discover high dividend stocks with earning power and strong balance sheets.

Be seeing you!

* * * * * * *

(Reuters) – Power company Exelon Corp (EXC.N) struck a deal to buy rival Constellation Energy Group (CEG.N) for $7.9 billion in a bid to become the largest generator of competitively priced electricity in the United States.

It would be the latest in a string of deals in the fragmented U.S. utility industry, which faces new costs to upgrade power grids and meet environmental controls.

It is Exelon Chief Executive John Rowe’s latest — and likely last — attempt to transform his company through acquisitions. Exelon was thwarted in efforts to buy independent power producer NRG Energy Inc (NRG.N) in 2009, Public Service Enterprise Group (PEG.N) in 2006, and Illinois Power in 2003.

The combined company will keep the Exelon name and its headquarters in Chicago. Rowe plans to retire after the deal closes, and Exelon Chief Operating Officer Christopher Crane will become the new company’s CEO. Constellation CEO Mayo Shattuck will become executive chairman.

"This enterprise will have the scale and financial strength to drive expansion in competitive energy markets, as well as new investment in the next wave of clean generation and sustainable products and services," Shattuck said.

Constellation shareholders will receive 0.93 Exelon share for each Constellation share, the companies said in a statement.

The offer values Constellation at $38.59 a share — 12.5 percent above its Wednesday closing price of $34.30.

Exelon said the deal is expected to increase its 2013 earnings by more than 5 percent.

Exelon, among the leading U.S. utilities and the nation’s top nuclear power company, will add 1.2 million customers to its existing 5.4 million. The combined company will serve Maryland, Illinois and Pennsylvania.

About 55 percent of the new entity’s power generation fleets will be nuclear, 24 percent natural gas, 8 percent renewable and hydro, 7 percent oil and 6 percent coal.

Exelon shares were off 35 cents ay $41.14 in morning trade, while Constellation was up 3.5 percent to $35.49.

REGULATORY HURDLES

The companies expect the deal to close early in 2012. But utility deals in the United States are usually drawn-out procedures that face tough scrutiny from states and regulators.

Constellation has faced challenges in closing its own deals in the past. Florida power company FPL Group Inc scrapped a $12.5 billion takeover of Constellation in 2006 after the merger became embroiled in Maryland state politics.

Recent deals in the industry indicate utilities believe regulators are becoming more receptive to consolidation. Duke Energy (DUK.N) has offered $13.7 billion for Progress Energy (PGN.N), Northeast Utilities (NU.N) is buying NSTAR (NST.N) for $4.2 billion, and AES Corp (AES.N) has bid $3.5 billion for DPL Inc (DPL.N).

The Exelon-Constellation deal must be approved by shareholders of both companies, the Federal Energy Regulatory Commission, the Nuclear Regulatory Commission, state regulators in Maryland, New York and Texas, and other regulatory bodies.

Following completion of the deal, Exelon shareholders will own about 78 percent of the combined company.

Barclays Capital, J.P. Morgan Securities, Evercore Partners and Loop Capital Markets were financial advisers to Exelon.

Morgan Stanley, Goldman Sachs and Credit Suisse advised Constellation.

(Reporting by Michael Erman in New York and Krishna N Das in Bangalore; Editing by Saumyadeb Chakrabarty, Ian Geoghegan and John Wallace)

Link to original article: http://www.reuters.com/article/2011/04/28/us-constellation-exelon-idUSTRE73Q8BS20110428

April 28, 2011 09:49 AM Eastern Daylight Time 

Kendall Law Group Investigates Constellation Energy Group, Inc. Merger for Shareholders

DALLAS–(BUSINESS WIRE)–Kendall Law Group, led by former federal judge Joe Kendall, is investigating Constellation Energy Group, Inc. (NYSE: CEG) for shareholders in connection with the proposed acquisition by Exelon Corporation. The national securities firm’s investigation seeks to determine whether Constellation Energy and its Board breached their fiduciary duties by entering into the agreement without properly shopping for a deal that would provide better value for shareholders. If you are a Constellation Energy shareholder and would like additional information about your rights, contact the Kendall Law Group at 877-744-3728 or by email at skendall@kendalllawgroup.com.

On April 28, 2011, the companies announced the definitive merger agreement under which Constellation Energy would be acquired by Exelon, in a transaction valued at approximately $7.9 billion. Under the terms of the agreement, Constellation Energy stockholders will receive 0.93 Exelon shares (NYSE: EXC) for each share of Constellation Energy/CEG common stock held. The value of consideration being offered is worth approximately $38.59 a share, which represents a 12.5 percent premium over Constellation Energy stock’s Wednesday closing price of $34.30. The firm’s investigation seeks to determine whether Constellation Energy and its Board undertook a fair process in negotiating the deal.

Kendall Law Group was founded by a former federal judge, includes a former United States Attorney, prosecutors and securities lawyers who are experienced in complex securities litigation. The firm has been counsel in numerous merger and acquisition cases nationwide, including some of the largest transactions in the United States.

Contacts

Kendall Law Group LLP
Scott Kendall, 214-744-3000
877-744-3728 Toll Free
214-744-3015 Facsimile
skendall@kendalllawgroup.com
www.kendalllawgroup.com

Image002

Link to original article: http://www.businesswire.com/news/home/20110428006191/en/Kendall-Law-Group-Investigates-Constellation-Energy-Group

Published in: on April 28, 2011 at 4:53 pm  Leave a Comment  

A summary on Safe Bulkers ahead of earnings. High dividend + value.

Reuters is reporting that unnamed securities analysts think Safe Bulkers (SB) will earn between $0.32 and $0.43 per share in 1Q2011.  Safe Bulkers will report 1Q2011 earnings after the market closes on May 3rd, 2011.  Safe Bulkers $0.15 quarterly dividend is safe.

Dividend payout ratio – Let’s assume for a moment that the low estimate of $0.32 is accurate.  Their dividend payout ratio would be 47% (dividend per share/earnings per share or $0.15/$0.32).  If the best case proved to be true, then the dividend payout ratio would drop to 35%.  Either way the dividend is safe.

Dividend yield – Safe Bulkers is a high dividend stock yielding 7.41% ($0.60/$8.10).  It has paid $0.15 per quarter for the past nine quarters.

Earning power – The company has a five year average earning power of $1.50 and only trades at 5.4 times the 5 yr. average earnings.  That is a rare value in this stock market.

Balance sheet – recovering and improving

Image002

Subscribe today for free at www.myhighdividendstocks.com/feed to discover high dividend stocks with earning power and strong balance sheets.

Be seeing you!

SOURCE: Safe Bulkers, Inc.

April 28, 2011 09:00 ET

Safe Bulkers, Inc. Sets Date for First Quarter 2011 Results, Dividend Announcement, Conference Call and Webcast

Earnings Release: Tuesday, May 3, 2011, After Market Closes; Conference Call and Webcast: Wednesday, May 4, 2011 at 09:00 A.M. EDT

ATHENS, GREECE–(Marketwire – Apr 28, 2011) – Safe Bulkers, Inc. (the Company) (NYSE: SB), an international provider of marine drybulk transportation services, announced today that it will release its results for the quarter ended March 31, 2011 after the market closes in New York on Tuesday, May 3, 2011. The Company also expects to announce the declaration of a dividend for the first quarter 2011 at that time.

On Wednesday, May 4, 2011 at 9:00 A.M. EDT, the Company’s management team will host a conference call to discuss the financial results.

Conference Call details:

Participants should dial into the call 10 minutes before the scheduled time using the following numbers: 1 (866) 819-7111 (US Toll Free Dial In), 0(800) 953-0329 (UK Toll Free Dial In) or +44 (0)1452-542-301 (Standard International Dial In). Please quote "Safe Bulkers" to the operator.

In case of any problem with the above numbers, please dial 1 (866) 223-0615 (US Toll Free Dial In), 0(800) 694-1503 (UK Toll Free Dial In) or +44 (0)1452 586-513 (Standard International Dial In). Please quote "Safe Bulkers" to the operator.

A telephonic replay of the conference call will be available until May 13th by dialling 1 (866) 247-4222 (US Toll Free Dial In), 0(800) 953-1533 (UK Toll Free Dial In) or +44 (0)1452 550-000 (Standard International Dial In). Access Code: 1859591#

Slides and audio webcast:

There will also be a live, and then archived, webcast of the conference call, available through the Company’s website (www.safebulkers.com). Participants to the live webcast should register on the website approximately 10 minutes prior to the start of the webcast.

About Safe Bulkers, Inc.

The Company is an international provider of marine drybulk transportation services, transporting bulk cargoes, particularly coal, grain and iron ore, along worldwide shipping routes for some of the world’s largest users of marine drybulk transportation services. The Company’s common stock is listed on the NYSE, where it trades under the symbol "SB." The Company’s current fleet consists of 16 drybulk vessels, all built post-2003, and the Company has contracted to acquire 11 additional drybulk newbuild vessels to be delivered at various times through 2014.

Published in: on April 28, 2011 at 11:50 am  Leave a Comment  

Jefferies likes AGNC’s innovative approach to risk management. Yikes!

Jefferies thinks American Capital Agency Corp. (AGNC) is fairly valued.  Words like “innovative approach to risk management” makes me think of Enron and their “innovative approaches”.  Likewise, words like “sophisticated hedging strategy” sounds to me like a house of cards propped up with counterparty risk.  The financial health of AGNC’s unnamed hedging counterparties cannot be determined.  Would you want to enter into a hedge with Lehman Brothers, AIG, or any other bankster?

Subscribe today for free at www.myhighdividendstocks.com/feed to discover high dividend stocks with earning power and strong balance sheets.

Be seeing you!

* * * * * * *

American Capital Agency’s (NASDAQ: AGNC) reported 1Q11 results were $0.12 above consensus and book value grew 7% Q/Q. Despite substantial ROE outperformance and the most innovative approach to risk management in the REIT space, Jefferies views the shares as fairly valued. AGNC currently trades to a 1.15 multiple of book value, a justifiable premium to the pure-play Agency REIT average of 1.1x.

During the quarter, AGNC doubled the size of their investment portfolio. Surprising to Jefferies was the company’s focus on fixed-rate product, which represented 82% of the total portfolio at quarter-end. Importantly, AGNC does not own TBA mortgages, but rather the company tends to focus on specified pools.

In 1Q11, AGNC increased its exposure not only to plain vanilla interest rate swaps, but also swaptions, synthetic I/O securities, and TBA and Treasury positions in order to increase the duration of their hedge portfolio. AGNC clearly employs the most sophisticated hedging strategy in the mortgage REIT space, Agency or non-Agency.

Jefferies has a $29 PT and Hold rating on AGNC

American Capital Agency closed Tuesday at $28.83

Read more: http://www.benzinga.com/analyst-ratings/analyst-color/11/04/1036131/jefferies-comments-on-american-capital-agency-following-#ixzz1KlL2IMiU

Published in: on April 27, 2011 at 4:15 pm  Leave a Comment  

Bernanke’s Q&A.

Bernanke’s Q&A

from LewRockwell.com Blog

We can watch the Bernanke press conference, a response to Ron Paul, at 2:15 pm Eastern time this afternoon.

* * * * * * *

The Federal Reserve is definitely on the defensive.  This is their first press conference in its 97 year history.  They prefer to unknown and boring while quietly eroding your purchasing power year after year.  Their actions affect your investments and savings (usually for the worst).

Subscribe today for free at www.myhighdividendstocks.com/feed to discover high dividend stocks with earning power and strong balance sheets.

Be seeing you!

Published in: on April 27, 2011 at 10:29 am  Leave a Comment  

American Capital Agency (AGNC) reports 1Q2011 earnings; dividend still not safe.

American Capital Agency Corp. (AGNC) dividend is not safe.  It has a current dividend payout ratio of 107.6%.  Any payout ratio above 100% is a warning to the dividend investor to expect a cut in the future.  The company earned $1.30 per share for its reoccurring business operations of borrowing short (repurchase agreements) and lending long (agency securities).  But that wasn’t enough to cover the $1.40 quarterly dividend per share.

The company earned another $0.18 per share from the net realized gains on sales of agency securities, derivatives, and trading securities.  You can’t count on reoccurring income from these sales and hedges.

The company reported an improvement to its book value from $24.24 to $25.96.  Remember this – AGNC’s liabilities are real, but its asset values must be questioned.  The housing market is not done being clobbered and the government guarantees on agency securities are empty promises.  I place little faith in the book values of financial companies.  Think Lehman Brothers and their nice book value prior to their implosion.

The company remains highly leveraged 7.4 times.  I don’t like this.  It is a house of cards with an attractive dividend yield.  Net interest rate spreads remain the same as last quarter.  This will not change until interest rates rise.  Interest rates will rise.  It is only a matter of time before this house of financial cards comes crashing down.  Austrian economists predicted the the 2007-2008 crash back in 2005.  They are predicting another crash in the next few years depending on the actions of the Federal Reserve and the commercial bankers.

In summary:

·         Dividend – AGNC has a spectacular 19% dividend yield based on shaky leverage and an inflationary Federal Reserve.  A cut is coming in the next year.

·         Earning power – Its dividend is not supported by its reoccurring operations.  Its three year average earnings per share of $1.18 would only be slightly improved by a continuation of this quarter’s performance for the rest of 2011.  Only new capital issues and the occasional sale of some agency securities at a gain are keeping it afloat.

·         Balance sheet – Its balance sheet is horrible because its like a banks: borrowed short and lent long.  The moment that its 25 unnamed credit suppliers cease to rollover its short term debts the whole house of cards will come crumbling down.

You can view the earnings press release here: http://prn.to/AGNC1Q

Subscribe today for free at www.myhighdividendstocks.com/feed to discover high dividend stocks with earning power and strong balance sheets.

Be seeing you!

BETHESDA, Md., April 25, 2011 /PRNewswire/ — American Capital Agency Corp. (“AGNC” or the “Company”) (Nasdaq: AGNC) today reported net income for the first quarter of 2011 of $133.5 million, or $1.48 per share, and book value of $25.96 per share.

FIRST QUARTER 2011 FINANCIAL HIGHLIGHTS

·         $1.48 per share of net income

o    $1.30 per share, excluding $0.18 per share of other investment related income

·         $1.68 per share of taxable income(1)

·         $1.40 per share first quarter dividend

·         $0.42 per share of undistributed taxable income as of March 31, 2011

o    Undistributed taxable income increased $16 million to $55 million

·         $25.96 book value per share as of March 31, 2011

o    Increased $1.72, or 7%, from $24.24 per share as of December 31, 2010

·         22% annualized return on average stockholders’ equity (“ROE”) for the quarter(2)

OTHER FIRST QUARTER HIGHLIGHTS

·         $28 billion investment portfolio value as of March 31, 2011

·         13% constant prepayment rate (“CPR”) for the first quarter of 2011(3)

o    11% CPR for the month of April 2011(4)

·         7.6x leverage as of March 31, 2011(5)

o    7.4x average leverage for the quarter

·         2.58% annualized net interest rate spread for the quarter

o    2.42% net interest spread as of March 31, 2011

·         $1.75 billion of net proceeds raised from equity offered during quarter

o    $1.61 billion raised in two follow-on offerings

o    $141 million raised pursuant to a Controlled Equity Offering(SM) Sales Agreement and via direct share purchase plan share issuances

o    All equity raised was accretive to book value

Here is the press release in its entirety:

BETHESDA, Md., April 25, 2011 /PRNewswire/ — American Capital Agency Corp. (“AGNC” or the “Company”) (Nasdaq: AGNC) today reported net income for the first quarter of 2011 of $133.5 million, or $1.48 per share, and book value of $25.96 per share.

FIRST QUARTER 2011 FINANCIAL HIGHLIGHTS

·         $1.48 per share of net income

o    $1.30 per share, excluding $0.18 per share of other investment related income

·         $1.68 per share of taxable income(1)

·         $1.40 per share first quarter dividend

·         $0.42 per share of undistributed taxable income as of March 31, 2011

o    Undistributed taxable income increased $16 million to $55 million

·         $25.96 book value per share as of March 31, 2011

o    Increased $1.72, or 7%, from $24.24 per share as of December 31, 2010

·         22% annualized return on average stockholders’ equity (“ROE”) for the quarter(2)

OTHER FIRST QUARTER HIGHLIGHTS

·         $28 billion investment portfolio value as of March 31, 2011

·         13% constant prepayment rate (“CPR”) for the first quarter of 2011(3)

o    11% CPR for the month of April 2011(4)

·         7.6x leverage as of March 31, 2011(5)

o    7.4x average leverage for the quarter

·         2.58% annualized net interest rate spread for the quarter

o    2.42% net interest spread as of March 31, 2011

·         $1.75 billion of net proceeds raised from equity offered during quarter

o    $1.61 billion raised in two follow-on offerings

o    $141 million raised pursuant to a Controlled Equity Offering(SM) Sales Agreement and via direct share purchase plan share issuances

o    All equity raised was accretive to book value

“Our American Capital Agency team delivered another strong quarter with our strategy of actively managing the portfolio,” said John Erickson, AGNC Executive Vice President and Chief Financial Officer. “This strong performance occurred in a quarter marked by significant global economic and political events, which required the periodic reconsideration of investment strategies. Even in this challenging environment, we grew our book value by 7% to $25.96 per share and earned $1.48 per share of net income while taking steps to reduce risk. In addition, we have added to our AGNC investment staff to broaden our expertise, improve our depth and address the Company’s significant growth.”

“We continue to believe the combination of strong asset quality and diversification, coupled with a thoughtful hedging strategy, which includes some optional protection, remains critical to our ability to achieve our dual mandates of generating attractive returns for our shareholders and protecting book value within reasonable bands,” said Gary Kain, President and Chief Investment Officer of AGNC. “During the first quarter of 2011, the Company raised over $1.7 billion in new equity and continued to produce solid returns across a wide range of different measures.  Book value, undistributed taxable earnings and what many analysts call ‘core earnings’ were all higher during the quarter, despite lower leverage resulting from the typical time lags associated with deploying new capital.”

INVESTMENT PORTFOLIO

As of March 31, 2011, the Company’s investment portfolio totaled $28.2 billion of agency securities, at fair value, comprised of $22.9 billion of fixed-rate agency securities, $4.9 billion of adjustable-rate agency securities (“ARMs”) and $0.4 billion of collateralized mortgage obligations (“CMOs”) backed by fixed and adjustable-rate agency securities(6).  As of March 31, 2011, AGNC’s investment portfolio was comprised of 44% </= 15-year fixed-rate securities, 5% 20-year fixed-rate securities, 32% 30-year fixed-rate securities(7), 18% adjustable-rate securities and 1% CMOs backed by fixed and adjustable-rate agency securities.  

ASSET YIELDS, COST OF FUNDS AND NET INTEREST RATE SPREAD

During the quarter, the annualized weighted average yield on the Company’s average earning assets was 3.39% and its annualized average cost of funds was 0.81%, which resulted in a net interest rate spread of 2.58%, unchanged from the fourth quarter of 2010.  As of March 31, 2011, the weighted average yield on the Company’s earning assets was 3.47% and its weighted average cost of funds was 1.05%(8).  This resulted in a net interest rate spread of 2.42% as of March 31, 2011, an increase of 14 bps from the weighted average net interest rate spread as of December 31, 2010 of 2.28%(9).  

The weighted average cost basis of the investment portfolio was 104.4% (or 104.0% excluding interest-only strips) as of March 31, 2011. The amortization of premiums (net of any accretion of discounts) on the investment portfolio for the quarter was $48.0 million, or $0.53 per share.  The unamortized net premium as of March 31, 2011 was $1.2 billion.

The Company’s asset yield benefitted from purchases of higher yielding securities late in the fourth quarter of 2010 and during the quarter as the Company invested capital from its recent capital raises subsequent to recent increases in interest rates and from a decline in the projected CPR for the remaining life of the Company’s investments. Premiums and discounts associated with purchases of agency securities are amortized or accreted into interest income over the estimated life of such securities, using the effective yield method. Given the relatively high cost basis of the Company’s mortgage assets, slower prepayment projections can have a meaningful positive impact on asset yields.  The projected CPR for the remaining life of the Company’s investments as of March 31, 2011 was 10%; a decrease from 12% as of December 31, 2010.  The decrease in the projected CPR is largely due to purchases of lower coupon securities during the quarter coupled with increases in both spot and forward interest rates. The actual CPR for the Company’s portfolio held in the first quarter of 2011 was 13%, a decrease from 18% during the fourth quarter of 2010.  The most recent CPR for the Company’s portfolio for the month of April 2011 was 11%.

The Company’s average cost of funds declined 9 basis points from 0.90% for the fourth quarter of 2010 to 0.81% for the first quarter of 2011, due largely to timing differences between asset settlements and the initiation of new interest rate swap contracts. These differences led to lower effective swap costs during the quarter than is expected to occur in future periods. The cost of funds as of March 31, 2011 includes both current and forward starting swaps balances, net of expirations, within three months of quarter end.

LEVERAGE AND HEDGING ACTIVITIES

As of March 31, 2011, the Company’s $28.2 billion investment portfolio was financed with $22.0 billion of repurchase agreements, $0.1 billion of other debt(10) and $3.3 billion of equity capital, resulting in a leverage ratio of 6.6x.  When adjusted for the net payable for agency securities not yet settled, the leverage ratio was 7.6x as of March 31, 2011.  The average leverage for the quarter was 7.4x as the Company deployed capital from its recent equity raises.

Of the $22.0 billion borrowed under repurchase agreements as of March 31, 2011, $5.7 billion had original maturities of 30 days or less, $8.7 billion had original maturities greater than 30 days and less than or equal to 60 days, $5.8 billion had original maturities greater than 60 days and less than or equal to 90 days and the remaining $1.8 billion had original maturities of 91 days or more. As of March 31, 2011, the Company had repurchase agreements with 25 financial institutions.    

The Company’s interest rate swap positions as of March 31, 2011 totaled $15.1 billion in notional amount at an average fixed pay rate of 1.79%, a weighted average receive rate of 0.25% and a weighted average maturity of 3.6 years.  During the quarter, the Company increased its swap position, including forward starting swaps ranging up to twelve months, by $8.5 billion in conjunction with an increase in the portfolio size.  The new swap agreements entered into during the quarter have an average term of approximately 4.2 years and a weighted average fixed pay rate of 1.93%. The Company intends the use of swaps with longer maturities to protect its book value and longer term earnings potential.

The Company also utilizes swaptions to mitigate the Company’s exposure to larger changes in interest rates.  During the quarter, the Company added $1.6 billion of payer swaptions at a cost of $17.2 million and $0.3 billion of receiver swaptions at a cost of $0.4 million. During the quarter, $0.3 billion of payer swaptions from a previous quarter expired or were sold.  As of March 31, 2011, the Company had $2.1 billion in payer swaptions outstanding at a market value of $21.3 million.

As of March 31, 2011, 68% of the Company’s repurchase agreement balance and other debt were hedged through interest rate swap agreements. If net unsettled purchases and sales of securities are incorporated, this percentage declines to 60%.  These percentages do not reflect the swaps underlying the payer swaptions noted above, which have an average maturity of 6.1 years.

OTHER INCOME, NET

During the quarter, the Company produced $15.8 million in other income, net, or $0.18 per share.  Other income is comprised of $4.2 million of net realized gains on sales of agency securities, $31.0 million of net realized gains on derivative and trading securities and $19.4 million of net unrealized losses, including reversals of prior period unrealized gains and losses realized during the current quarter, on derivative and trading securities that are marked-to-market in current income.  

The net gains and losses (realized and unrealized) on derivative and trading securities generally represent instruments that are used to supplement the Company’s interest rate swaps (such as swaptions and short or long positions in “to-be-announced” mortgage securities (TBA’s), Markit IOS total return swaps(11) and  treasury securities). Under accounting rules, these positions are not in hedge relationships and consequently are accounted for through current income instead of shareholders’ equity.  The Company uses these supplemental hedges to reduce its exposure to interest rates.

TAXABLE INCOME

Taxable income for the first quarter of 2011 was $1.68 per share, or $0.20 higher than GAAP net income per share for the quarter. The primary difference between tax and GAAP net income is unrealized gains and losses associated with derivatives marked-to-market in current income for GAAP purposes but excluded from taxable income until realized or settled. Taxable income for the first quarter of 2011 benefited from the settlement of gains derived from short TBA positions and payer swaptions entered into during the fourth quarter of 2010. As of March 31, 2011, net unrealized gains that have been recognized for GAAP, but excluded from taxable income, totaled $10 million. Assuming no change in market prices as of March 31, 2011, the Company anticipates recognizing most of these net gains as taxable income during the second quarter of 2011.

NET ASSET VALUE

As of March 31, 2011, the Company’s net asset value per share was $25.96, or $1.72 higher than the December 31, 2010 net asset value per share of $24.24.  

FIRST QUARTER 2011 DIVIDEND DECLARATION

On March 7, 2011, the Board of Directors of the Company declared a first quarter 2011 dividend of $1.40 per share payable on April 27, 2011, to stockholders of record as of March 23, 2011. Since its May 2008 initial public offering, the Company has paid or declared a total of $499.2 million in dividends, or $14.66 per share.  After adjusting for the first quarter 2011 accrued dividend, the Company had approximately $55 million of undistributed taxable income as of March 31, 2011, an increase of $16 million from December 31, 2010. Undistributed taxable income per share as of March 31, 2011 was $0.42 per share.  

(1) Based on the weighted average shares outstanding for the quarter.  Please refer to the section on the use of Non-GAAP financial

Published in: on April 26, 2011 at 12:32 pm  Leave a Comment  

Debunking Anti-Gold Propaganda.


A meme is now circulating that gold is in a bubble and that it’s time for the wise investor to sell. To me, that’s a ridiculous notion. Certainly a premature one.

It pays to remain as objective as you can be when analyzing any investment. People have a tendency to fall in love with an asset class, usually because it’s treated them so well. We saw that happen, most recently, with Internet stocks in the late ’90s and houses up to 2007. Investment bubbles are driven primarily by emotion, although there’s always some rationale for the emotion to latch on to. Perversely, when it comes to investing, reason is recruited mainly to provide cover for passion and preconception.

In the same way, people tend to hate certain investments unreasonably, usually at the bottom of a bear market, after they’ve lost a lot of money and thinking about the asset means reliving the pain and loss. Love-and-hate cycles occur for all investment classes.

But there’s only one investment I can think of that many people either love or hate reflexively, almost without regard to market performance: gold. And, to a lesser degree, silver. It’s strange that these two metals provoke such powerful psychological reactions – especially among people who dislike them. Nobody has an instinctive hatred of iron, copper, aluminum or cobalt. The reason, of course, is that the main use of gold has always been as money. And people have strong feelings about money. Let’s spend a moment looking at how gold’s fundamentals fit in with the psychology of the current market.

What Gold Is – and Why It’s Hated

Let me first disclose that I’ve always been favorably inclined toward gold, simply because I think money is a good thing. Not everyone feels that way, however. Some, with a Platonic view, think that money and commercial activity in general are degrading and beneath the “better” sort of people – although they’re a little hazy about how mankind rose above the level of living hand-to-mouth, grubbing for roots and berries. Some think it’s “the root of all evil,” a view that reflects a certain attitude toward the material world in general. Some (who have actually read St. Paul) think it’s just the love of money that’s the root of all evil. Some others see the utility of money but think it should be controlled somehow – as if only the proper authorities knew how to manage the dangerous substance.

From an economic viewpoint, however, money is just a medium of exchange and a store of value. Efforts to turn it into a political football invariably are a sign of a hidden agenda or perhaps a psychological aberration. But, that said, money does have a moral as well as an economic significance. And it’s important to get that out in the open and have it understood. My view is that money is a high moral good. It represents all the good things you hope to have, do and provide in the future. In a manner of speaking, it’s distilled life. That’s why it’s important to have a sound money, one that isn’t subject to political manipulation.

Over the centuries many things have been used as money, prominently including cows, salt and seashells. Aristotle thought about this in the 4th century BCE and arrived at the five characteristics of a good money:

Of the 92 naturally occurring elements, gold (secondarily silver) has proved the best money. It’s not magic or superstition, any more than it is for iron to be best for building bridges and aluminum for building airplanes.

Of course we do use paper as money today, but only because it recently served as a receipt for actual money. Paper money (currency) historically has a half-life that depends on a number of factors. But it rarely lasts longer than the government that issues it. Gold is the best money because it doesn’t need to be “faith-based” or rely on a government.

There’s much more that can be said on this topic, and it’s important to grasp the essentials in order to understand the controversy about whether or not gold is in a bubble. But this isn’t the place for an extended explanation.

Keep these things in mind, though, as you listen to the current blather from talking heads about where gold is going. Most of them are just journalists, reporters that are parroting what they heard someone else say. And the “someone else” is usually a political apologist who works for a government. Or a hack economist who works for a bank, the IMF or a similar institution with an interest in the status quo of the last few generations. You should treat almost everything you hear about finance or economics in the popular media as no more than entertainment.

So let’s take some recent statements, assertions and opinions that have been promulgated in the media and analyze them. Many impress me as completely uninformed, even stupid. But since they’re floating around in the infosphere, I suppose they need to be addressed.

Misinformation and Disinformation

Gold is expensive.

This objection is worth considering – for any asset. In fact, it’s critical. We can determine the price of almost anything fairly easily today, but figuring out its value is as hard as it’s ever been. From the founding of the U.S. until 1933, the dollar was defined as 1/20th of an ounce of gold. From 1933 it was redefined as 1/35th of an ounce. After the 1971 dollar devaluation, the official price of the metal was raised to $42.22 – but that official number is meaningless, since nobody buys or sells the metal at that price. More importantly, people have gotten into the habit of giving the price of gold in dollars, rather than the value of the dollar in gold. But that’s another subject.

Here’s the crux of the argument. Before the creation of the Federal Reserve in 1913, a $20 bill was just a receipt for the deposit of one ounce of gold with the Treasury. The U.S. official money supply equated more or less with the amount of gold. Now, however, dollars are being created by the trillion, and nobody really knows how many more of them are going to be shazammed into existence.

It is hard to determine the value of anything when the inch marks on your yardstick keep drifting closer and closer together.

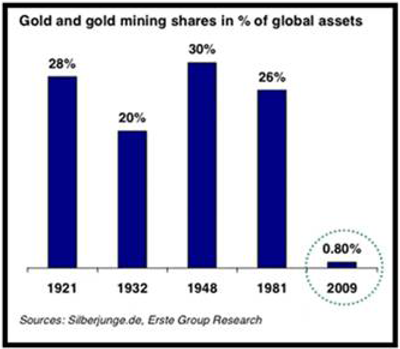
The smart money is long gone from gold.

This is an interesting assertion that I find based on nothing at all. Who really is the smart money? How do you really know that? And how do you know exactly what they own (except for, usually, many months after the fact) or what they plan on buying or selling? The fact is that very few billionaires (John Paulson perhaps best known of them) have declared a major position in the metal. Gold and gold stocks, as the following chart shows, are only a tiny proportion of the financial world’s assets, either absolutely or relative to where they’ve been in the past:

Image002

Gold is risky.

Risk is largely a function of price. And, as a general rule, the higher the price the higher the risk, simply because the supply is likely to go up and the demand to go down – leading to a lower price. So, yes, gold is riskier now, at $1,400, than it was at $700 or at $200. But even when it was at $35, there was a well-known financial commentator named Eliot Janeway (I always thought he was a fool and a blowhard) who was crowing that if the U.S. government didn’t support it at $35, it would fall to $8.

In any event, risk is relative. Stocks are very risky today. Bonds are ultra risky. Real estate is in an ongoing bear market. And the dollar is on its way to reaching its intrinsic value.

Yes, gold is risky at $1,400. But it is actually less risky than most alternatives.

Gold pays no interest.

This is kind of true. But only in the sense that a $100 bill pays no interest. You can get interest from anything that functions as money if it is lent out. Interest is the time premium of money. You will not get interest from either your $100 or from your gold unless you lend them to someone. But both the dollars and the gold will earn interest if you lend them out. The problem is that once you make a loan (even to a bank, in the form of a savings account), you may not even get your principal back, much less the interest.

Gold pays no dividends.

Of course it doesn’t. It also doesn’t yield chocolate syrup. It’s a ridiculous objection, because only corporations pay dividends. It’s like expecting your Toyota in the driveway to pay a dividend, when only the corporation in Japan can do so. But if you want dividends related to gold, you can buy a successful gold mining stock.

Gold costs you insurance and storage.

This is arguably true. But it’s really a sophistic misdirection to which many people uncritically nod in agreement. You may very well want to insure and professionally store your gold. Just as you might your jewelry, your artwork and most valuable things you own. It’s even true of the share certificates for stocks you may own. It’s true of the assets in your mutual fund (where you pay for custody, plus a management fee).

You can avoid the cost of insurance and storage by burying gold in a safe place – something that’s not a practical option with most other valuable assets. But maybe you really don’t want to store and insure your gold, because the government may prove a greater threat than any common thief. And if you pay storage and insurance, they’ll definitely know how much you have and where it is.

Gold has no real use.

This assertion stems from a lack of knowledge of basic chemistry as well as economics. Yes, of course people have always liked gold for jewelry, and that’s a genuine use. It’s also good for dentistry and micro-circuitry. Owners of paper money, however, have found the stuff to be absolutely worthless hundreds of times in many score of countries.

In point of fact, gold is useful because it is the most malleable, the most ductile and the most corrosion resistant of all metals. That means it’s finding new uses literally every day. It’s also the second most conductive of heat and electricity, and the second most reflective (after silver). Gold is a hi-tech metal for these reasons. It can do things no other substance can and is part of the reason your computer works so well.

But all these reasons are strictly secondary, because gold’s main use has always been (and I’ll wager will be again) as money. Money is its highest and best use, and it’s an extremely important one.

The U.S. can, or will, sell its gold to pay its debt, depressing the market.

I find this assertion completely unrealistic. The U.S. government reports that it owns 265 million ounces of gold. Let’s say that’s worth about $400 billion right now. I’m afraid that’s chicken feed in today’s world. It’s only a quarter of this year’s federal deficit alone. It’s only half of one year’s trade deficit. It represents only about 5% of the dollars outside the U.S. The U.S. government may be the largest holder of gold in the world, but it owns less than 5% of the approximately 6 billion ounces above ground.

From the ‘60s until about 2000, most Western governments were selling gold from their treasuries, working on the belief it was a “barbarous relic.” Since then, governments in the advancing world – China, India, Russia and many other ex-socialist states – have been buying massive quantities.

Why? Because their main monetary asset is U.S. dollars, and they have come to realize those dollars are the unbacked liability of a bankrupt government. They’re becoming hot potatoes, Old Maid cards. But the dollars can be replaced with what? Sovereign wealth funds are using them to buy resources and industries, but those things aren’t money. And in the hands of bureaucrats, they’re guaranteed to be mismanaged. I expect a great deal of gold buying from governments around the world over the next few years. And it will be at much higher dollar prices.

High gold prices will bring on huge new production, which will depress its price.

This assertion shows a complete misunderstanding of the nature of the gold market. Gold production is now about 82.6 million ounces per year and has been trending slightly down for the last decade. That’s partly because at high prices miners tend to mine lower-grade ore. And partly because the world has been extensively explored, and most large, high-grade, easily exploited resources have already been put into production.

But new production is trivial relative to the 6 billion ounces now above ground, which only increases by about 1.3% annually. Gold isn’t consumed like wheat or even copper; its supply keeps slowly rising, like wealth in general. What really controls gold’s price is the desire of people to hold it, or hold other things – new production is a trivial influence.

That’s not to say things can’t change. The asteroids have lots of heavy metals, including gold; space exploration will make them available. Gigantic amounts of gold are dissolved in seawater and will perhaps someday be economically recoverable with biotech. It’s now possible to transmute metals, fulfilling the alchemists dream; perhaps someday this will be economic for gold. And nanotech may soon allow ultra-low-grade deposits of gold (and every other element) to be recovered profitably. But these things need not concern us as practical matters in the course of this bull market.

You should have only a small amount of gold, for insurance.

This argument is made by those who think gold is only going to be useful if civilization breaks down, when it could be an asset of last resort. In the meantime, they say, do something productive with your money…

This is poor speculative theory. The intelligent investor allocates his funds where it’s likely they’ll provide the best return, consistent with the risk, liquidity and volatility profile he wants to maintain. There are times when you should be greatly overweight in a single asset class – sometimes stocks, sometimes bonds, sometimes real estate, sometimes what-have-you. For the last 12 years, it’s been wise to be overweight in gold. You always want some gold, simply because it’s cash in the most basic form. But ten years from now, I suspect that will be a minimum. Right now it’s a maximum. The idea of keeping a constant, but insignificant, percentage in gold impresses me as poorly thought out.

Interest rates are at zero; gold will fall as they rise.

In principle, as interest rates rise, people tend to prefer holding currency deposits. So they tend to sell other assets, including gold, to own interest-earning cash. But there are other factors at work. What if the nominal interest rate is 20%, but the rate of currency depreciation is 40%? Then the real interest rate is minus 20%. This is more or less what happened in the late ‘70s, when both nominal rates and gold went up together. Right now governments all over the world are suppressing rates even while they’re greatly increasing the amount of money outstanding; this will eventually (read: soon) result in both much higher rates and a much higher general price level. At some point high real rates will be a factor in ending the gold bull market, but that time is many months or years in the future.

Gold sentiment is at an all-time high.

Although gold prices are at an all-time high in nominal terms, they are still nowhere near their highs in real terms, of about $2,500 (depending on how much credibility you give the government’s CPI numbers), reached in 1980. Gold sentiment is still quite subdued among the public; most of them barely know it even exists.

Some journalists like to point out that since there are a few (five, perhaps) gold dispensing machines in the world, including one in the U.S., that there’s a gold mania afoot. That’s ridiculous, although it shows a slowly awakening interest among people with assets.

Journalists also point to the numerous ads on late-night TV offering to buy old gold jewelry (generally at around a 50% discount from its metal value) as a sign of a gold bubble. But this is even more ridiculous, since the ads are inducing the unsophisticated, cash-strapped booboisie to sell the metal, not buy it.

You’ll know sentiment is at a high when major brokerage firms are hyping newly minted gold products, and Slime Magazine (if it still exists) has a cover showing a golden bull tearing apart the New York Stock Exchange. We’re a long way from that point.

Mining stocks are risky.

This is absolutely true. In general, mining is a horrible business. It requires gigantic fixed capital expense to build the mine, but only after numerous, expensive and unpredictable permitting issues are handled. Then the operation is immovable and subject to every political risk imaginable, not infrequently including nationalization. Add in continual and formidable technical issues of every description, compounded by unpredictable fluctuations in the price of the end product. Mining is a horrible business, and you’ll never find Graham-Dodd investors buying mining stocks.

All these problems (and many more that aren’t germane to this brief article), however, make them excellent speculative vehicles from time to time.

Mineral exploration stocks are very, very risky.

This is very, very true. There are thousands of little public companies, and some are just a couple steps up from a prospector wandering around with a mule. Others are fairly sophisticated, hi-tech operations. Exploration companies are often classed with mining companies, but they are actually very different animals. They aren’t so much running a business as engaging in a very expensive and long-odds treasure hunt.

That’s the bad news. The good news is that they are not only risky but extraordinarily volatile. The most you can lose is 100%, but the market cyclically goes up 10 to 1, with some stocks moving 1,000 to 1. That kind of volatility can be your best friend. Speculating in these issues, however, requires both expertise and a good sense of market timing. But they’re likely to be at the epicenter of the gold bubble when it arrives – even though few actually have any gold, except in their names.

Warren Buffett is a huge gold bear.

This is true, but irrelevant – entirely apart from suffering from the logical fallacy called “argument from authority.” But, nonetheless, when the world’s most successful investor speaks, it’s worth listening. Here’s what Buffett recently said about gold in an interview with Ben Stein, another goldphobe: "You could take all the gold that’s ever been mined, and it would fill a cube 67 feet in each direction. For what that’s worth at current gold prices, you could buy all – not some, all – of the farmland in the United States. Plus, you could buy 10 Exxon Mobils, plus have $1 trillion of walking-around money. Or you could have a big cube of metal. Which would you take? Which is going to produce more value?"

I’ve long considered Buffett an idiot savant – a genius at buying stocks but at nothing else. His statement is quite accurate, but completely meaningless. The same could be said of the U.S. dollar money supply – or even of the world inventory of steel and copper. These things represent potential but are not businesses or productive assets in themselves. Buffett is certainly not stupid, but he’s a shameless and intellectually dishonest sophist. And although a great investor, he’s neither an economist or someone who believes in free markets.

Gold is a religious statement.

Actually, since most religions have an otherworldly orientation, they’re at least subtly (and often stridently) anti-gold. But it is true that some promoters of gold seem to have an Elmer Gantry-like style. That, however, can be said of True Believers in anything, whether or not the belief itself has merit. In point of fact, I think it’s more true to say goldphobes suffer from a kind of religious hysteria, fervently believing in collectivism in general and the state in particular, with no regard to counter-arguments. Someone who understands why gold is money and why it is currently a good speculative vehicle is hardly making a religious statement. More likely he’s taking a scientific approach to economics and thinking for himself.

So Where Are We?

So these are some of the more egregious arguments against gold that are being brought forward today. Most of them are propounded by knaves, fools or the uninformed.

My own view should be clear from the responses I’ve given above. But let me clarify it a bit further. Historically – actually just up until the decades after World War I, when world governments started issuing paper currency with no relation to gold – the metal was cash, and it was used as money everywhere, on a daily basis. I believe that will again be the case in the fairly near future.

The question is: At what price will that occur, relative to other things? It’s not just a question of picking a dollar price, because the relative value of many things – houses, food, commodities, labor – have been distorted by a very long period of currency inflation, increased taxation and very burdensome regulation that started at the beginning of the last depression. Especially with the fantastic leaps in technology now being made and breathtaking advances that will soon occur, it’s hard to be sure exactly how values will realign after the Greater Depression ends. And we can’t know the exact manner in which it will end. Especially when you factor in the rise of China and India.

A guess? I’ll say the equivalent of about $5,000 an ounce of today’s dollars. And I feel pretty good about that number, considering where we are in the current gold bull market. Classic bull markets have three stages. We’ve long since left the “Stealth” stage – when few people even remembered gold existed, and those who did mocked the idea of owning it. We’re about to leave the “Wall of Worry” stage, when people notice it and the bulls and bears battle back and forth. I’ll conjecture that within the next year we’ll enter the “Mania” stage – when everybody, including governments, is buying gold, out of greed and fear. But also out of prudence.

The policies of Bernanke and Obama – but also of almost every other central bank and government in the world – are not just wrong. These people are, perversely, doing just the opposite of what should be done to cure the problems that have built up over decades. One consequence of their actions will be to ignite numerous other bubbles in various markets and countries. I expect the biggest bubble will be in gold, and the wildest one in mining and exploration stocks.

When will I sell out of gold and gold stocks? Of course, they don’t ring a bell at either the top or the bottom of the market. But I expect to be a seller when there really is a bubble, a mania, in all things gold-related. There’s a good chance that will coincide to some degree with a real bottom in conventional stocks. I don’t know what level that might be on the DJIA, but I’d think its average dividend yield might then be in the 6 to 8% area.

The bottom line is that gold and its friends are no longer cheap, but they have a long way – in both time and price – to run. Until they’re done, I suggest you be right and sit tight.


If you take the time to learn more about gold and silver, you’ll realize quickly that both still have a long way to go in this bull market. And with China – and other countries – ready to dump the flailing U.S. dollar, it’s imperative to protect yourself with precious metals. Learn more about China’s secret plot here.

April 23, 2011

Doug Casey (send him mail) is a best-selling author and chairman of Casey Research, LLC., publishers of Casey’s International Speculator.

Copyright © 2001 Casey and Associates

Published in: on April 25, 2011 at 12:42 pm  Leave a Comment  

Warning: Investors Still Confident in the US Bond Market

Warning: Investors Still Confident in the US Bond Market

leadimage

04/22/11 Buenos Aires, Argentina – First let us catch up with a news report from earlier this week. Bloomberg:

April 18 (Bloomberg) – Standard & Poor’s put a “negative” outlook on the AAA credit rating of the US, citing a “material risk” the nation’s leaders will fail to deal with rising budget deficits and debt.

“We believe there is a material risk that US policy makers might not reach an agreement on how to address medium- and long-term budgetary challenges by 2013,” New York-based S&P said today in a report. “If an agreement is not reached and meaningful implementation does not begin by then, this would in our view render the US fiscal profile meaningfully weaker than that of peer ‘AAA’ sovereigns.”

Well, the press described the news as a “warning shot” or a “wake-up call.” Both of those descriptions are fairly positive. You get a warning shot…and you can turn around. You get a wake-up call and you wake up.

But what do you do when you’re running the world’s biggest Ponzi scheme? Do you stop? Do you “wake up”?

No, you deny it! “Don’t worry,” you tell investors.

The New York Times:

…Treasury secretary, Timothy F. Geithner…said on Fox Business Network there was “no risk” that the United States would lose its AAA credit rating, disagreeing with Standard & Poor’s negative assessment, and said that investors were still confident in government bonds.

Well, yes. Investors are still confident in US bonds. Then again, investors were still confident in US houses in 2007…and still confident in US tech stocks in 1999.

It is only because they are confident that bond yields are so low. But what would bond yields do if investors began to be less confident? Imagine where the price of gold would go!

Well, it turns out that confidence goeth before a fall. Especially in the bond market. Bond market cycles move so slowly that a whole generation of investors is led into great confidence…and then another generation mistrusts them forever. The proof comes to us from a report from Credit Suisse, by way of our Family Office strategist, Rob Marstrand. Rob is looking for real returns over long stretches of time. Bonds work…but like everything else, only sometimes. And this is not one of those times.

If you go to an investment manager and tell him you want to invest some money for your children, safely, securely, most likely he’ll tell you to buy bonds. And he’ll be right – but only when the bond market is in one of its boom phases. When it goes into a bust phase, watch out. You could be looking at losses for 50 years. Or maybe even permanent losses.

Rob reports:

The [Credit Suisse] report highlights two major periods when US bonds were in bear markets in real terms. The first was between August 1915 and June 1920. Bond values declined 51% and then remained underwater until August 1927. The recovery period from start to finish was 12 years. Or about the same as the recovery periods for stocks.

But far worse was the second bear market. Between December 1940 and September 1981 bonds fell 67% in real terms. And they took until September 1991 to get back to even. In other words, the bond market recovery period was over 50 years!

And some countries have had negative real returns in their bond markets for the entire 111 years covered by the study – including Belgium, Finland, Germany, Italy, and Japan.

US bonds have been going generally up in the US ever since Paul Volcker tamed inflation in 1983. That’s a long period in which to form opinions. Not surprisingly, the opinion shaped by this upward stretch is that investors have nothing to fear from US bonds. Confidence is high. But so is the risk of disappointment.

Today, the feds are committed to EZ money. We look around. We don’t see a Fed putting on the brakes after a “warning shot.” Instead, we see America’s central bank going full speed ahead. We don’t see a “Tall Paul” Volcker raising rates. Instead, we see “Short Ben” Bernanke holding them down at zero. We don’t see an administration “waking up” to the need to cut spending; we see the Obama Team dead asleep on the job, dreaming of more income redistribution, more social programs, more tax-the-rich money raisers…with no real idea of what is going on.

What we see is a huge Ponzi Scheme…where old debts are serviced only by raising new ones. The schemers don’t know it, but they’re on the road to Hell.

Bill Bonner
for The Daily Reckoning

 
Subscribe today for free at www.myhighdividendstocks.com/feed to discover high dividend stocks with earning power and strong balance sheets.
 
Be seeing you!
Published in: on April 23, 2011 at 9:56 pm  Leave a Comment  

TIP OF THE WEEK – The easy way to export & visualize 5 years of balance sheet data. ((Tip of the Week, EXC, Exelon, high dividend stocks))

The easy way to export & visualize 5 years of balance sheet data.

Jason Brizic

Apr. 22, 2011

You want to know if a company has a strong balance sheet.

You know how to view the balance sheet data online, but you still need to perform some calculations that meet your investment strategies.  Or maybe you want to compare two companies side-by-side.  You might be like me.  If so, then you love to see eye-glazing spreadsheet data in an easy to understand visual format where important changes in direction and magnitude jump out at you.

Use Morningstar’s export button on its Financials tab to quickly export balance sheet info to your spreadsheet program.  You can calculate or visualize from there.  Exelon has a nice stable balance sheet.  It would be nice to see them reduce their debts.

Image001

Here is how I produced this visualization of high dividend stock Exelon’s (EXC) basic balance sheet:

1)     Go to www.morningstar.com and type EXC into the quote box at the top

2)     Click on the Financials tab.  Then click on Balance Sheet.

3)     Click Export.  I chose to Open the file when given the choice to open or save.

4)     The file opened in Microsoft Excel 2007.  I adjusted the format to my liking.

5)     I deleted all rows but the dates and Total assets, Total liabilities, and Total shareholder equity.

6)     Chose Insert | Area chart.  Select the data.  Switch the horizontal and vertical axis.  Chose your series colors and chart add-ons like Titles, axis labels, etc.

Go to http://www.mrexcel.com/ for help with Microsoft Excel.

For more tips, go here:

http://www.myhighdividendstocks.com/category/tip-of-the-week

Published in: on April 22, 2011 at 3:45 pm  Leave a Comment  

Chart: Safe Bulkers (SB) basic balance sheet 2006-2010.

I’ve been experimenting with visualizing balance sheets over time.  Here is a chart of Safe Bulkers (SB) basic balance sheet from 2006 – 2010:

Image003

It is nice to see the rebound in stockholder’s equity since 2008.

Subscribe today for free at www.myhighdividendstocks.com/feed to discover high dividend stocks with earning power and strong balance sheets.

Be seeing you!

Published in: on April 21, 2011 at 4:53 pm  Leave a Comment  

Two views of Terra Nitrogen (TNH) VALUE or INVESTMENT?

Terra Nitrogen (TNH)

Market price: $110.75

Shares: 18.5 million

Dividend yield: 4.9%

Quarterly dividend: $1.36

Book value: $11.35

            EPS                   Net inc.             Adj. EPS

2006     $2.45                $45.73 M           $2.47

2007     $10.90              $205.782 M       $11.12

2008     $14.90              $422.385 M       $22.83

2009     $5.40                $100 M              $5.41

2010     $8.01                $148.2 M           $8.01

At first glance Terra Nitrogen appears to be a VALUE investment trading 11.1 times its 5 yr. average earnings.

Five year average earnings $9.97

12 times five year average earnings = $119.64

20 times five year average earnings = $199.40

If you believe that the last 5 years are more representative of Terra Nitrogen’s future performance, then TNH is a value at $110.75 per share.  However, the numbers change if you take a 10 year view of Terra Nitrogen.

Ten year average net income: $108.3 million

Ten year average earnings per share: $5.85

12 times ten year average earnings = $70.20

20 times ten year average earnings = $117.00

Terra Nitrogen is trading at 18.93 times its 10 yr. average earnings.  This is in the INVESTMENT basis range, and at nearly 20 times 10 yr. average earnings it is almost SPECULATIVE.

I like to take the longer term view when possible to be conservative.  I would buy TNH below $70.20.  It was priced below $70 in June 2010.  The stock has been on a large run since June 2010.  By waiting for a correction you can get a better dividend yield, the price to book value would be improved, and the price relative to earnings would be in the VALUE range.

Disclosure: I don’t own Terra Nitrogen (TNH).

Subscribe today for free at www.myhighdividendstocks.com/feed to discover high dividend stocks with earning power and strong balance sheets.

Be seeing you!

Published in: on April 20, 2011 at 1:21 pm  Leave a Comment